Nomalyze - A Django recipes analyzer.
Github repository Live website Use demo account: demo, example123
Project Overview
Nomalyze is a Django web app for managing a personal recipe collection and analyzing it with simple charts. Nomalyze served as my final Django project and received positive feedback from my mentor for going beyond the minimum course requirements.
- Role: Solo full-stack developer
- Context: Course project for a Full-Stack Web Development program
- Tech: Django, Python, PostgreSQL, HTML templates, Tailwind CSS, Pandas, Matplotlib, Render (PaaS)
The brief was to build a recipe app with Django, including basic CRUD, a computed “difficulty” value, and some form of analytics. I treated it as a chance to practice real-world full-stack concerns: data modeling, business logic, and deployment.
Read more about the brief and goalsCollapse brief and goals
The Challenge
The course brief asked for a Django-based recipe application where users could manage their own collection of dishes. Beyond simply storing recipes, the specification also introduced the idea of calculating how “difficult” a recipe is, and surfacing some basic statistics about the overall collection.
In practical terms, that meant turning a familiar domain (recipes) into a working web product that:
- models recipes and their attributes in a database,
- assigns each recipe a difficulty level, and
- offers a clearer overview of the collection than just a long list.
From a learning perspective, my challenge was to implement this brief in a way that felt close to a real-world project: using Django’s strengths, keeping the interface straightforward for non-technical users, and handling deployment details such as environment configuration, static files, and a production database.
Nomalyze is the resulting app: a personal recipe manager that not only stores recipes, but also analyzes them.
Objectives and Success Criteria
Within the provided brief, I defined a few concrete goals for myself:
-
Implement solid recipe management
Allow a user to add, view, edit, and delete recipes in a clean, simple interface. -
Turn “difficulty” into working logic
Use factors such as preparation time, cooking time, and ingredient count to automatically label each recipe as Easy, Medium, Intermediate, or Hard. -
Provide an analytics view
Summarize the recipe collection with basic charts and metrics (for example, distribution of difficulty levels or most common ingredients), using Python’s data tools. -
Deploy a production-ready version
Host the app on a managed platform with a PostgreSQL database, environment-based configuration, and working static file handling.
I considered the project successful if:
- The app was deployed and accessible online with a stable database behind it.
- The difficulty labels felt intuitive for typical home-cooking recipes.
- The analytics view offered a quick, visual overview instead of just another list of records.
- I could clearly explain the technical and design decisions behind the app to both non-technical reviewers and developers.
Architecture Overview
Nomalyze is a classic Django app: a recipes data model, Django views and templates, plus a small analytics pipeline using Pandas and Matplotlib.
Read architecture detailsCollapse architecture details
- Model–View–Template (MVT): browser requests are routed to Django views, which use the ORM to read and write
Recipedata and render HTML templates with the resulting context. - Data layer: recipes are stored in a relational database (SQLite in development, PostgreSQL in production). Each recipe records fields such as name, cooking time, ingredients and reference links, which makes querying and analytics straightforward.
- Difficulty & analytics flow: the difficulty level (Easy, Medium, Intermediate, Hard) is computed in Python based on cooking time and number of ingredients. For analytics, a dedicated view pulls data into Pandas, runs aggregations (e.g. difficulty distribution, ingredient frequency), and uses Matplotlib to generate charts that are embedded back into Django templates.
- Frontend & assets: the UI is built with Django templates styled via Tailwind CSS. Static assets are served in production with WhiteNoise to keep deployment simple.
- Deployment: the app runs on Render, using environment variables and
dj-database-urlfor environment-based configuration, with Gunicorn as the WSGI server.
What the app does
From a user’s point of view, Nomalyze lets you:
- Add, edit, and delete recipes in a simple interface
- See each recipe’s difficulty (Easy, Medium, Intermediate, Hard)
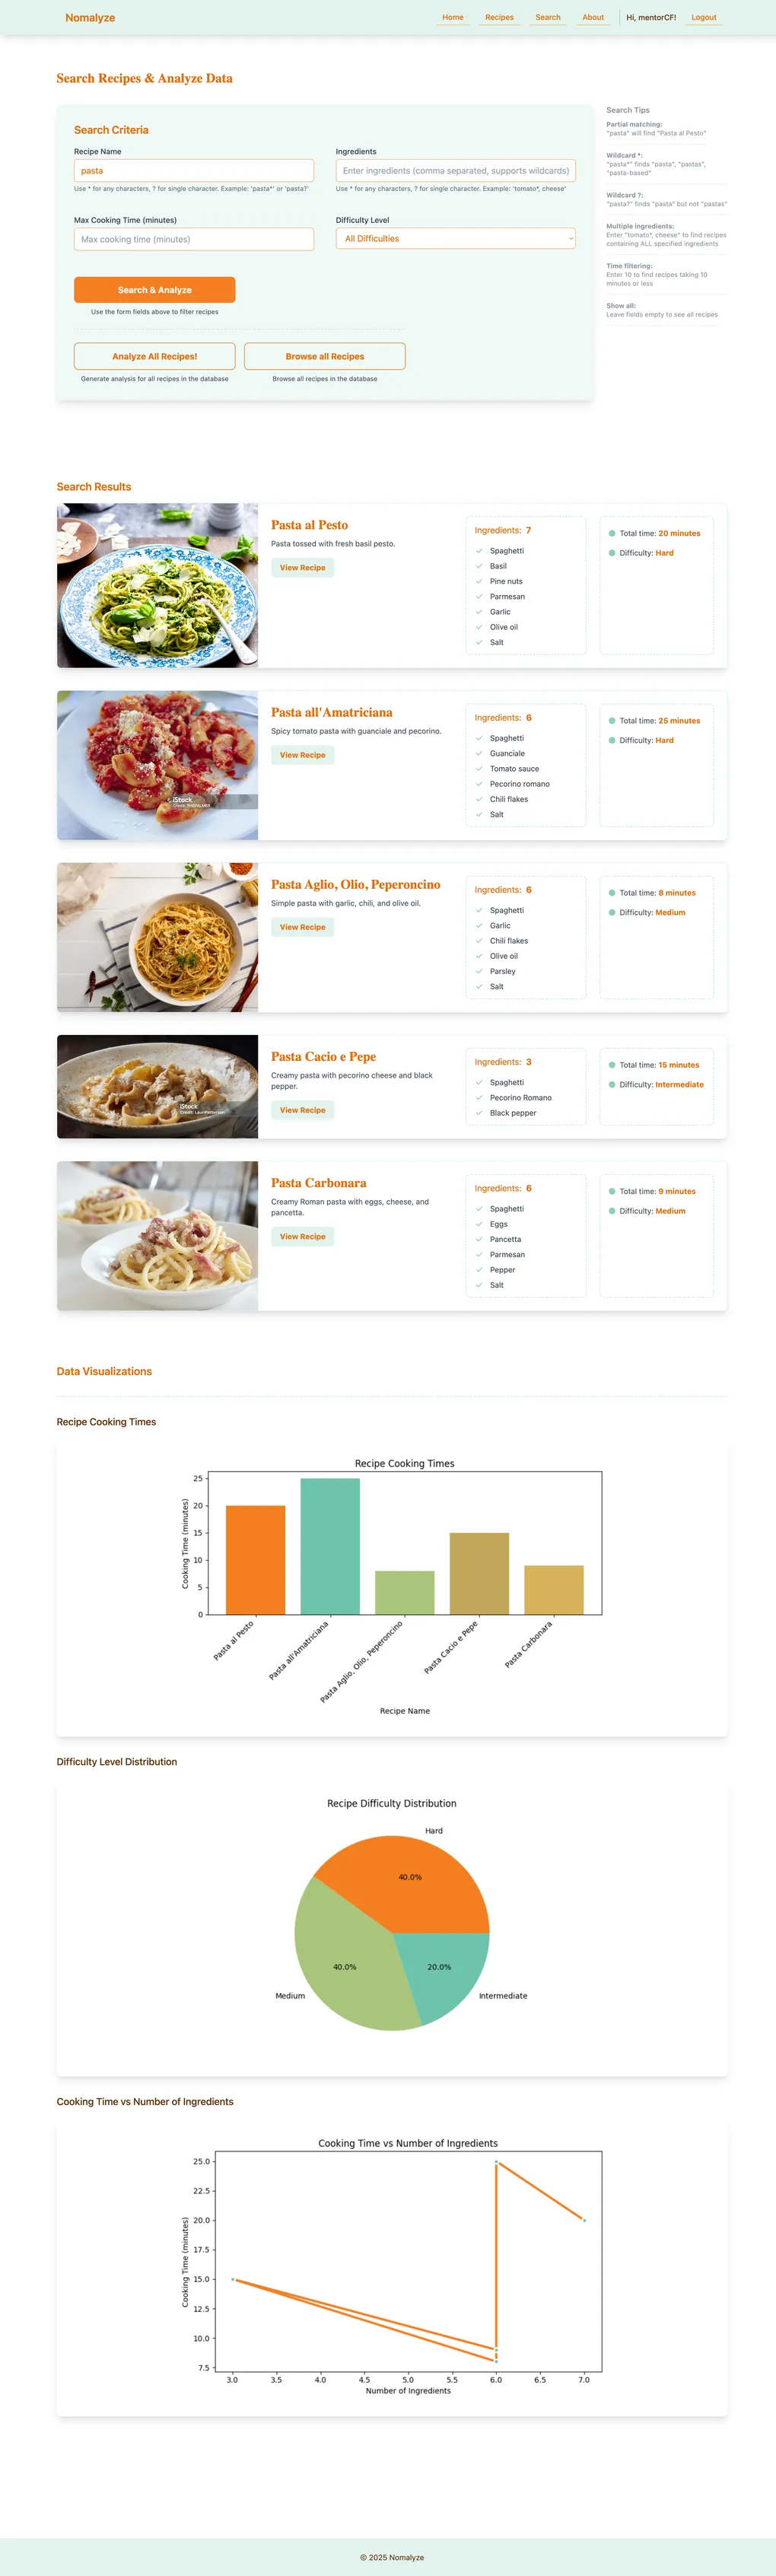
- Search and filter recipes by name, ingredients, max cooking time, and difficulty — including partial and wildcard matches (e.g. “Pasta al” also finds “Pasta al Pesto” and “Pasta all’Amatriciana”)
- View basic analytics, such as difficulty distribution and common ingredients
The difficulty calculation is intentionally simple and primarily serves as a learning exercise. It uses measurable fields (time and ingredients) to assign a label. It’s not intended to fully capture how professional cooks judge a recipe, but it shows how to turn a fuzzy idea into consistent, explainable code.
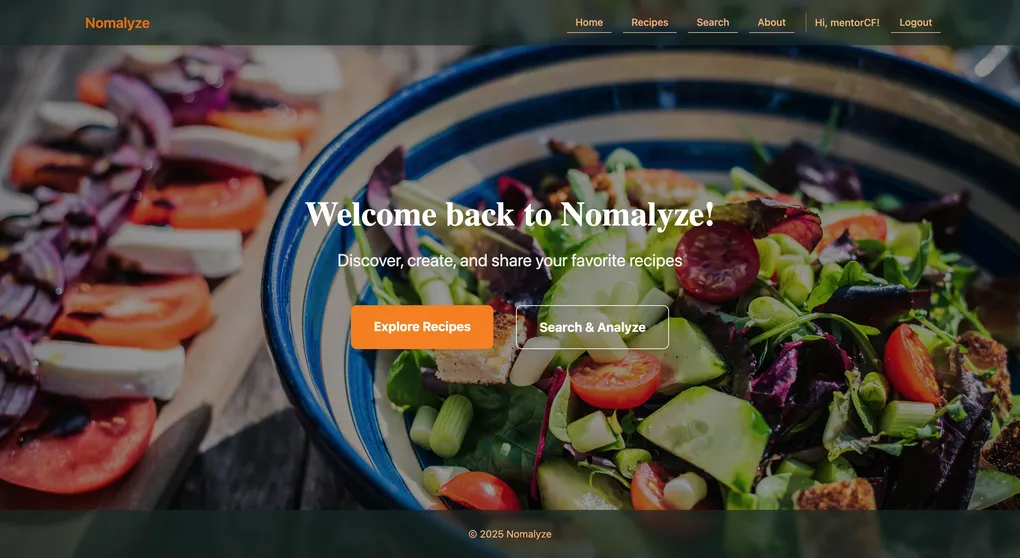
Home screen with quick access to recipes and analytics.
Implementation & Testing
Key implementation highlights
- Data model & CRUD: Designed Django models for recipes and built standard CRUD views with templates, focusing on clear forms and navigation.
- Difficulty logic: Encapsulated the difficulty rules in Python so labels update automatically when a recipe is saved.
- Search & filters: Implemented combined filters (e.g. by difficulty) and partial search queries using Django’s querying tools.
- Analytics: Pulled data into Pandas, aggregated it, and rendered Matplotlib charts inside Django templates.
- Deployment: Configured separate dev/production settings, used SQLite locally and PostgreSQL on Render, managed environment variables, and set up static file handling.
Read full implementation processCollapse full implementation process
Phase 1 – Understanding the brief and designing the data model
The course brief defined the basic idea: a Django web application that allows a user to manage recipes and see some statistics about them. Before writing any code, I translated this brief into concrete data structures.
I started by listing the information each recipe needed: title, description, ingredients, preparation steps, preparation time, cooking time, and any metadata that could influence difficulty. From there, I designed the Django models and relationships that would store this data in a relational database.
Even within a predefined brief, there were still small but important decisions to make: how to structure the fields, which values should be required, and how to prepare the data model for later features such as difficulty calculation and analytics. Getting this right early made it easier to write queries, build views, and extend the app later without having to constantly refactor the database schema.
Key learning: Even in a student project, thinking carefully about the data model saves time later, especially when analytics and custom logic depend on it.
Phase 2 – Building the core recipe experience (CRUD and navigation)
Once the data model was in place, I focused on the core experience: letting a user manage their recipes. This meant implementing the usual CRUD flow (create, read, update, delete) using Django views and templates.
I built pages for:
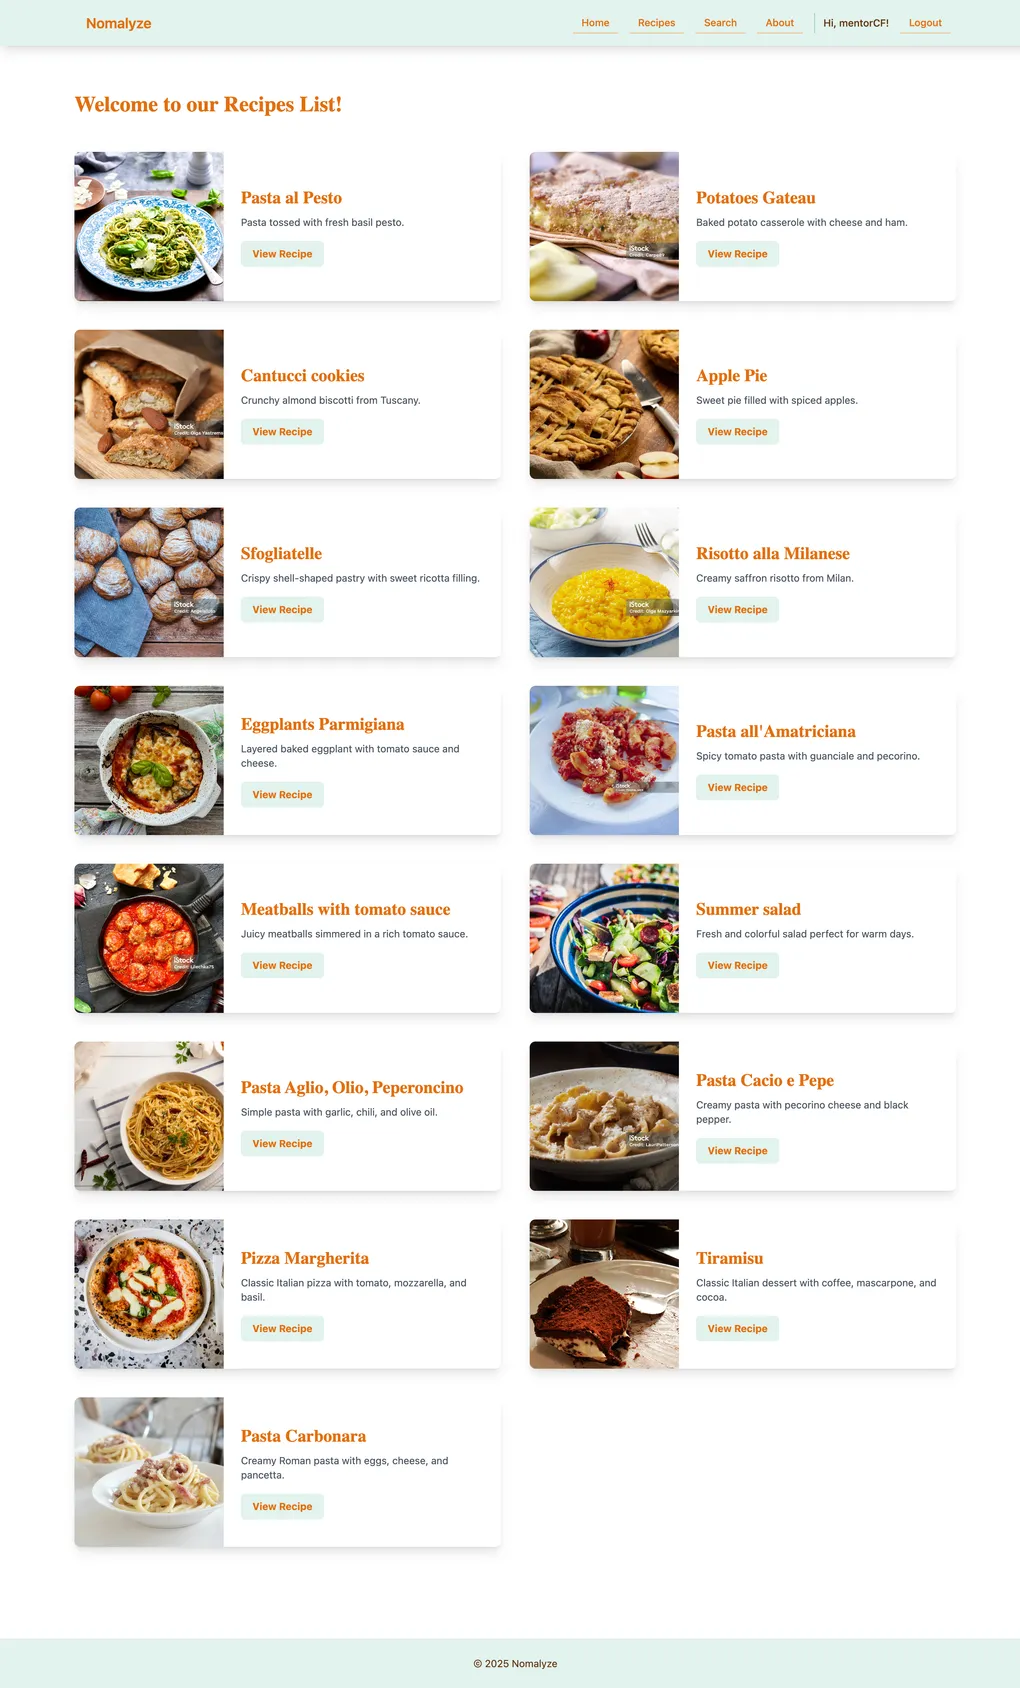
- viewing the list of recipes,
- adding and editing a recipe,
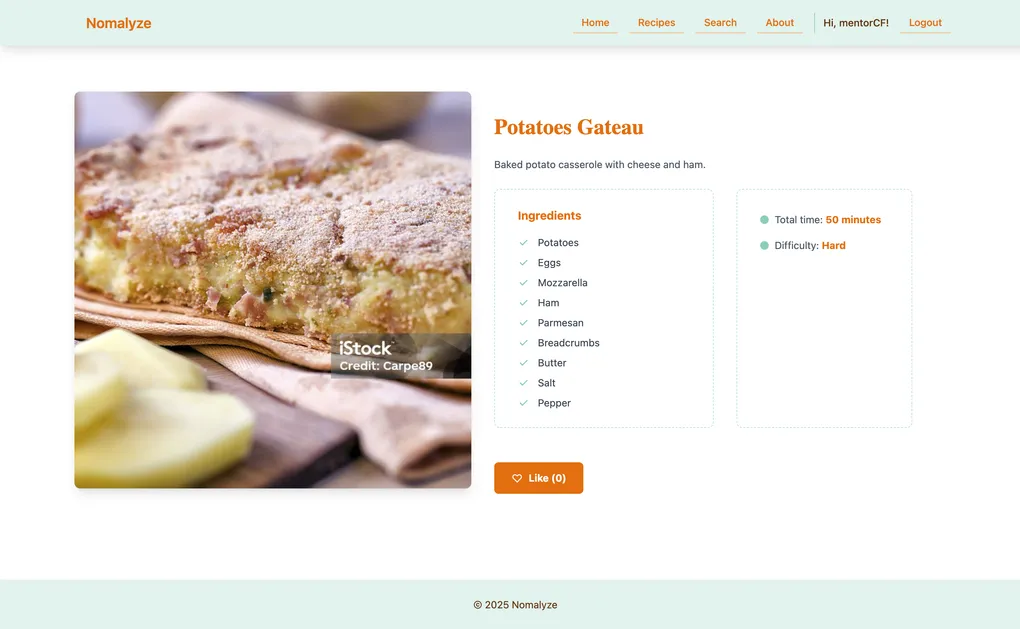
- and viewing the detailed page for a single recipe.
Throughout this phase, I tried to keep the interface simple and predictable: clear labels, logical grouping of fields, and straightforward navigation between listing and details. Tailwind CSS helped me quickly get to a clean, readable layout without spending too much time on custom styling.
The main challenge here was balancing completeness with clarity. The brief required several fields per recipe, and it’s easy to overwhelm users with a long form. I responded by grouping related information and focusing on a hierarchy that made sense from a cook’s point of view (title and key times first, less critical details later).
Key learning: A CRUD interface is more than just forms and tables; the way you present and group information strongly affects how usable the app feels.
Phase 3 – Turning “difficulty” into working logic
A central part of the assignment was to go beyond simply storing recipes and introduce some kind of intelligence. In Nomalyze, this took the form of a calculated difficulty level for each recipe, using four labels: Easy, Medium, Intermediate, and Hard.
Within the framework of the brief, I implemented a difficulty calculation that looks at several measurable aspects of a recipe, such as:
- how long it takes to prepare and cook,
- and how many ingredients it uses.
Based on these inputs, the app assigns the appropriate difficulty label and keeps it in sync when a recipe is saved or updated. The logic is encapsulated in the Django code so users don’t have to set the difficulty manually.
For the scope of this course project, the algorithm is intentionally simple and primarily serves as a learning exercise in translating a real-world concept into code. It’s not meant to capture every nuance that professional cooks or serious food enthusiasts would use to judge the true difficulty of a dish, but it does provide a consistent and explainable rule set for the app.
The hardest part was translating an intuitive, human idea (“this feels hard to cook”) into concrete rules and thresholds the app could apply consistently. I iterated through a few approaches and chose one that remained simple but still matched a basic common-sense expectation: very long or very complex recipes skew towards Hard, while short and straightforward recipes stay on the Easy end of the scale.
Key learning: Even a simple algorithm forces you to be explicit about assumptions. That exercise is very similar to what happens in real-world business rules.
Phase 4 – Adding search and filtering
Once the basic recipe management and difficulty calculation were in place, the next step was to make it easier to find relevant recipes inside the collection.
I added:
- a search function for recipe titles (and, depending on the implementation, other fields),
- filters based on difficulty level,
- and additional filters defined by the brief, such as time or categories.
The course also defined a bonus requirement: support wildcard and partial search queries. For example, searching for “Pasta al” should still return recipes like “Pasta al Pesto” or “Pasta all’Amatriciana.” I implemented the search logic to handle partial matches so that users don’t have to type the exact full title to find what they are looking for.
On the technical side, this meant writing Django queries that could combine multiple filter conditions and partial matches without becoming too complex or inefficient. On the UX side, I tried to keep the search and filter controls visible and understandable without overwhelming the page.
The challenge here was preventing the interface from becoming cluttered. Recipe apps can offer many potential filters, but exposing too many at once can confuse users. I prioritized a small set of filters that connected directly to the project’s main idea: exploring recipes by difficulty and key characteristics.
Key learning: Useful search and filtering is as much about deciding what not to include as it is about the queries themselves.
Phase 5 – Building the analytics view with Python’s data tools
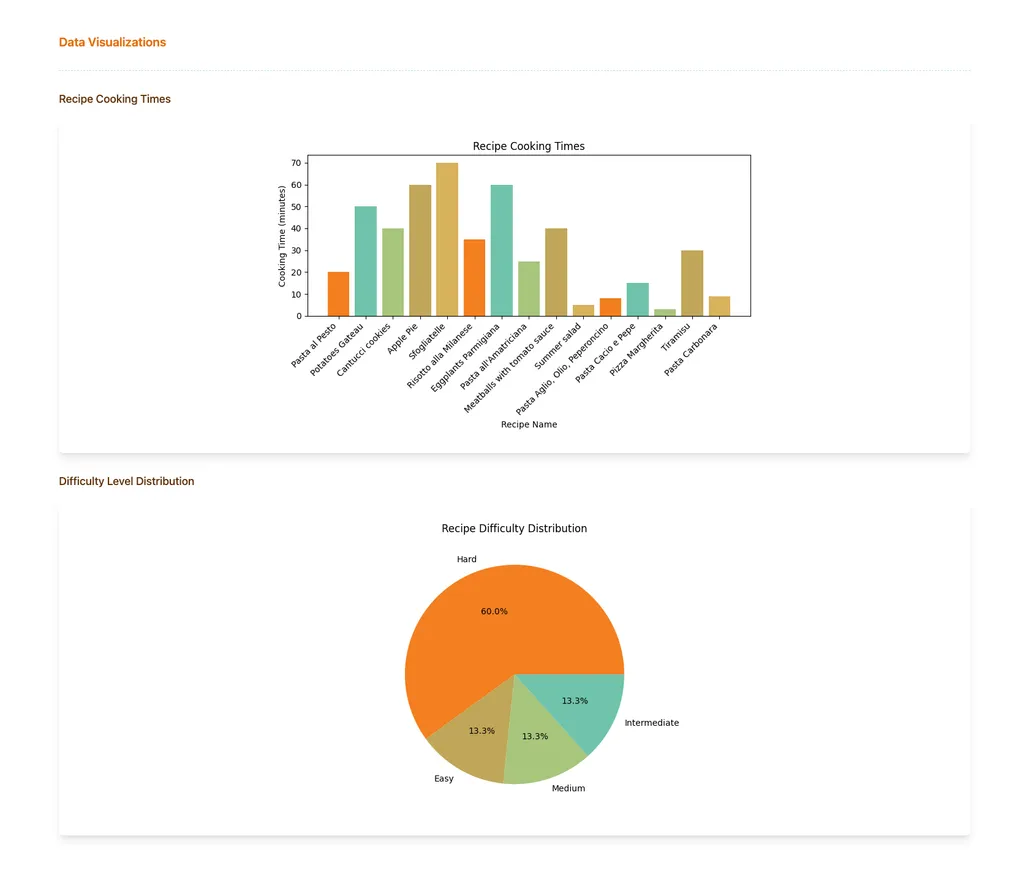
To meet the analytics requirement in the brief, I created a dedicated analytics view that summarizes the recipe collection. Instead of only browsing recipes one by one, the user can see aggregate information: for example, how many recipes are Easy, Medium, Intermediate, or Hard, or which ingredients appear most frequently.
Under the hood, this view pulls data from the database, processes it with Python’s data libraries (such as Pandas), and then generates charts using a plotting library like Matplotlib. These charts are rendered in the Django templates so they appear as part of the web interface.
The main challenge was integrating these libraries into a normal web request cycle. Tasks like data aggregation and chart generation can be heavier than a typical page load, so I had to think about how much processing was reasonable to do on each request and how to keep the analytics focused on the most useful metrics.
Key learning: Bringing data tools like Pandas into a web app is a powerful way to add value, but it also requires careful decisions about performance and what is truly useful to show.
Phase 6 – Preparing the app for production and deploying to Render
The final phase was to move Nomalyze from a local development environment to a live, publicly accessible one. The course required a real deployment, not just screenshots, so I set the app up on a platform-as-a-service provider (Render).
This meant:
- configuring separate settings for development and production,
- using SQLite locally but PostgreSQL in production,
- managing environment variables for sensitive data like secret keys and database URLs,
- and setting up static file handling (for CSS, images, and other assets) so they are correctly served in a production environment.
Learning to work with environment-based configuration and a production database was a significant step beyond running python manage.py runserver on my machine. I also had to troubleshoot common deployment issues, such as missing environment variables, database migration problems, or static files not loading correctly on the live site.
Key learning: Deployment forces you to think like a real-world developer: not just “does it work on my machine?” but “is this secure, configurable, and reliable in production?”
Testing strategy
Nomalyze includes an automated test suite built with Django’s TestCase framework, plus manual browser testing for the main user flows.
Read more about testingCollapse testing details
-
Automated tests:
src/recipes/tests.pycovers the core of the app:- models (validation, difficulty calculation, ingredient parsing)
- views (home, list, detail, search)
- forms (search form validation)
- URLs and templates
- chart utilities and wildcard search behaviour
- basic admin configuration
src/recipe_project/test_auth.pyfocuses on authentication flows, including login/logout views and session handling.- In total, 101 tests run successfully (as recorded in
test_results.txt), all passing in about 9 seconds. - Tests are executed via
python src/manage.py test.
-
Manual testing:
In addition to automated tests, I manually exercised the main user flows in the browser (creating, editing and deleting recipes; running different search/filter combinations; and generating analytics) to confirm that the behaviour matched expectations from a user’s point of view.
If I revisit the project, a natural next step would be to expand the automated tests around edge cases in the difficulty algorithm and more complex search/filter combinations, as well as adding regression tests for any new features.
Data visualization
UX & UI considerationsCollapse UX & UI considerations
UX & UI considerations
This project was primarily focused on backend, data and deployment, but my design background still influenced how I structured the interface.
A few examples:
- Recipe form layout: I grouped related fields (title, times, ingredients, steps) and ordered them from most to least important. This helps the form feel less overwhelming, even though it collects quite a lot of information.
- Search & analyze screen: I separated search criteria (name, ingredients, max cooking time, difficulty) from the “Search Tips” so users can discover wildcard and partial matching without cluttering the main controls. The primary button clearly communicates “Search & Analyze”.
- Consistent patterns: I reused the same basic layout and visual language across the home page, recipes list, detail view and analytics so the app feels coherent and predictable.
- Content-first styling: I kept the visual design simple and restrained, using Tailwind CSS mostly to support hierarchy and readability rather than heavy decoration. The focus stays on recipes, difficulty labels and charts.
ResultsCollapse results
Results
From a user’s perspective, Nomalyze provides:
- a simple way to store and manage a personal recipe collection,
- automatically assigned difficulty labels (Easy, Medium, Intermediate, Hard) that make the list easier to scan,
- and an analytics view that turns the raw list of recipes into charts and high-level insights.
From a learning perspective, this project helped me:
- design and implement a relational data model in Django,
- translate a fuzzy idea (“recipe difficulty”) into a concrete algorithm and integrate it into the web flow,
- work with Python’s data tools (Pandas and Matplotlib) inside a live web application,
- and deploy a production-ready Django app using environment-based configuration and a managed PostgreSQL database.
My mentor’s feedback highlighted that I went beyond the minimum requirements of the course brief, especially around implementation quality and the completeness of the deployed solution, which confirmed that I was on the right track in treating this as a realistic full-stack exercise rather than just a coding assignment.
Limitations and Trade-offsCollapse limitations and trade-offs
Limitations and Trade-offs
Even though the project met the course requirements, there are some clear limitations:
- The difficulty calculation is intentionally simple and primarily designed as a development exercise. Real recipe difficulty depends on many more factors (techniques, required equipment, timing overlap, etc.) than the app currently considers.
- The application assumes a single-user scenario and does not yet include authentication or personalized accounts.
- The analytics view focuses on a small set of metrics. It is useful for a quick overview, but it does not yet offer deeper exploration such as filtering analytics by tags, time range, or user-defined goals.
Being explicit about these trade-offs helps me keep a realistic view of what Nomalyze is: a solid, course-based full-stack project with room to grow, not a finished commercial product.
Future Improvements & RoadmapCollapse future improvements
Future Improvements & Roadmap
If I decide to revisit Nomalyze in the future, some natural extensions would be:
-
User accounts and personalization
Allow multiple users to sign up, manage their own collections, and see analytics that are specific to their profile. -
Richer difficulty model
Refine the difficulty calculation to incorporate more food-related nuances, such as techniques involved, number of steps, or the need for special equipment. This would push the project more into the intersection of development and my interest as a food nerd. -
More flexible analytics
Extend the analytics view to support filters (for example, by tag, cuisine, or time range) and possibly export options for people who want to take their data elsewhere. -
Improved search and discovery
Build on the existing partial/wildcard search to recommend related recipes or surface “hidden gems” in the collection based on patterns in the data.
These are not features I am actively working on right now, but they represent clear next steps if I choose to evolve the project further or revisit it to practice more advanced topics.
What I learned
Nomalyze gave me an end-to-end experience of building and shipping a Django app:
- Translating a written brief into a data model and UI,
- Expressing business rules as concrete, testable logic,
- Integrating Python’s data stack into a web application,
- Handling real deployment details like environment variables, production databases, and static assets.
It’s a course-based project, but it reflects how I approach full-stack work: clear requirements, pragmatic implementation, and an honest view of limitations and possible next steps.
Technologies Used
- Python
- Django 5.2
- PostgreSQL
- dj-database-url (environment-based DB configuration)
- Pandas (data processing and analytics)
- Matplotlib (data visualization)
- Tailwind CSS (responsive UI)
- WhiteNoise (serving static files in production)
- Gunicorn (WSGI server in production)
- Render (deployment / PaaS)
- pnpm, django-browser-reload (developer experience)